Understanding Your Dashboard
2 min readApril 12, 2026
dashboardmetricsrevenueoccupancy
Dashboard overview
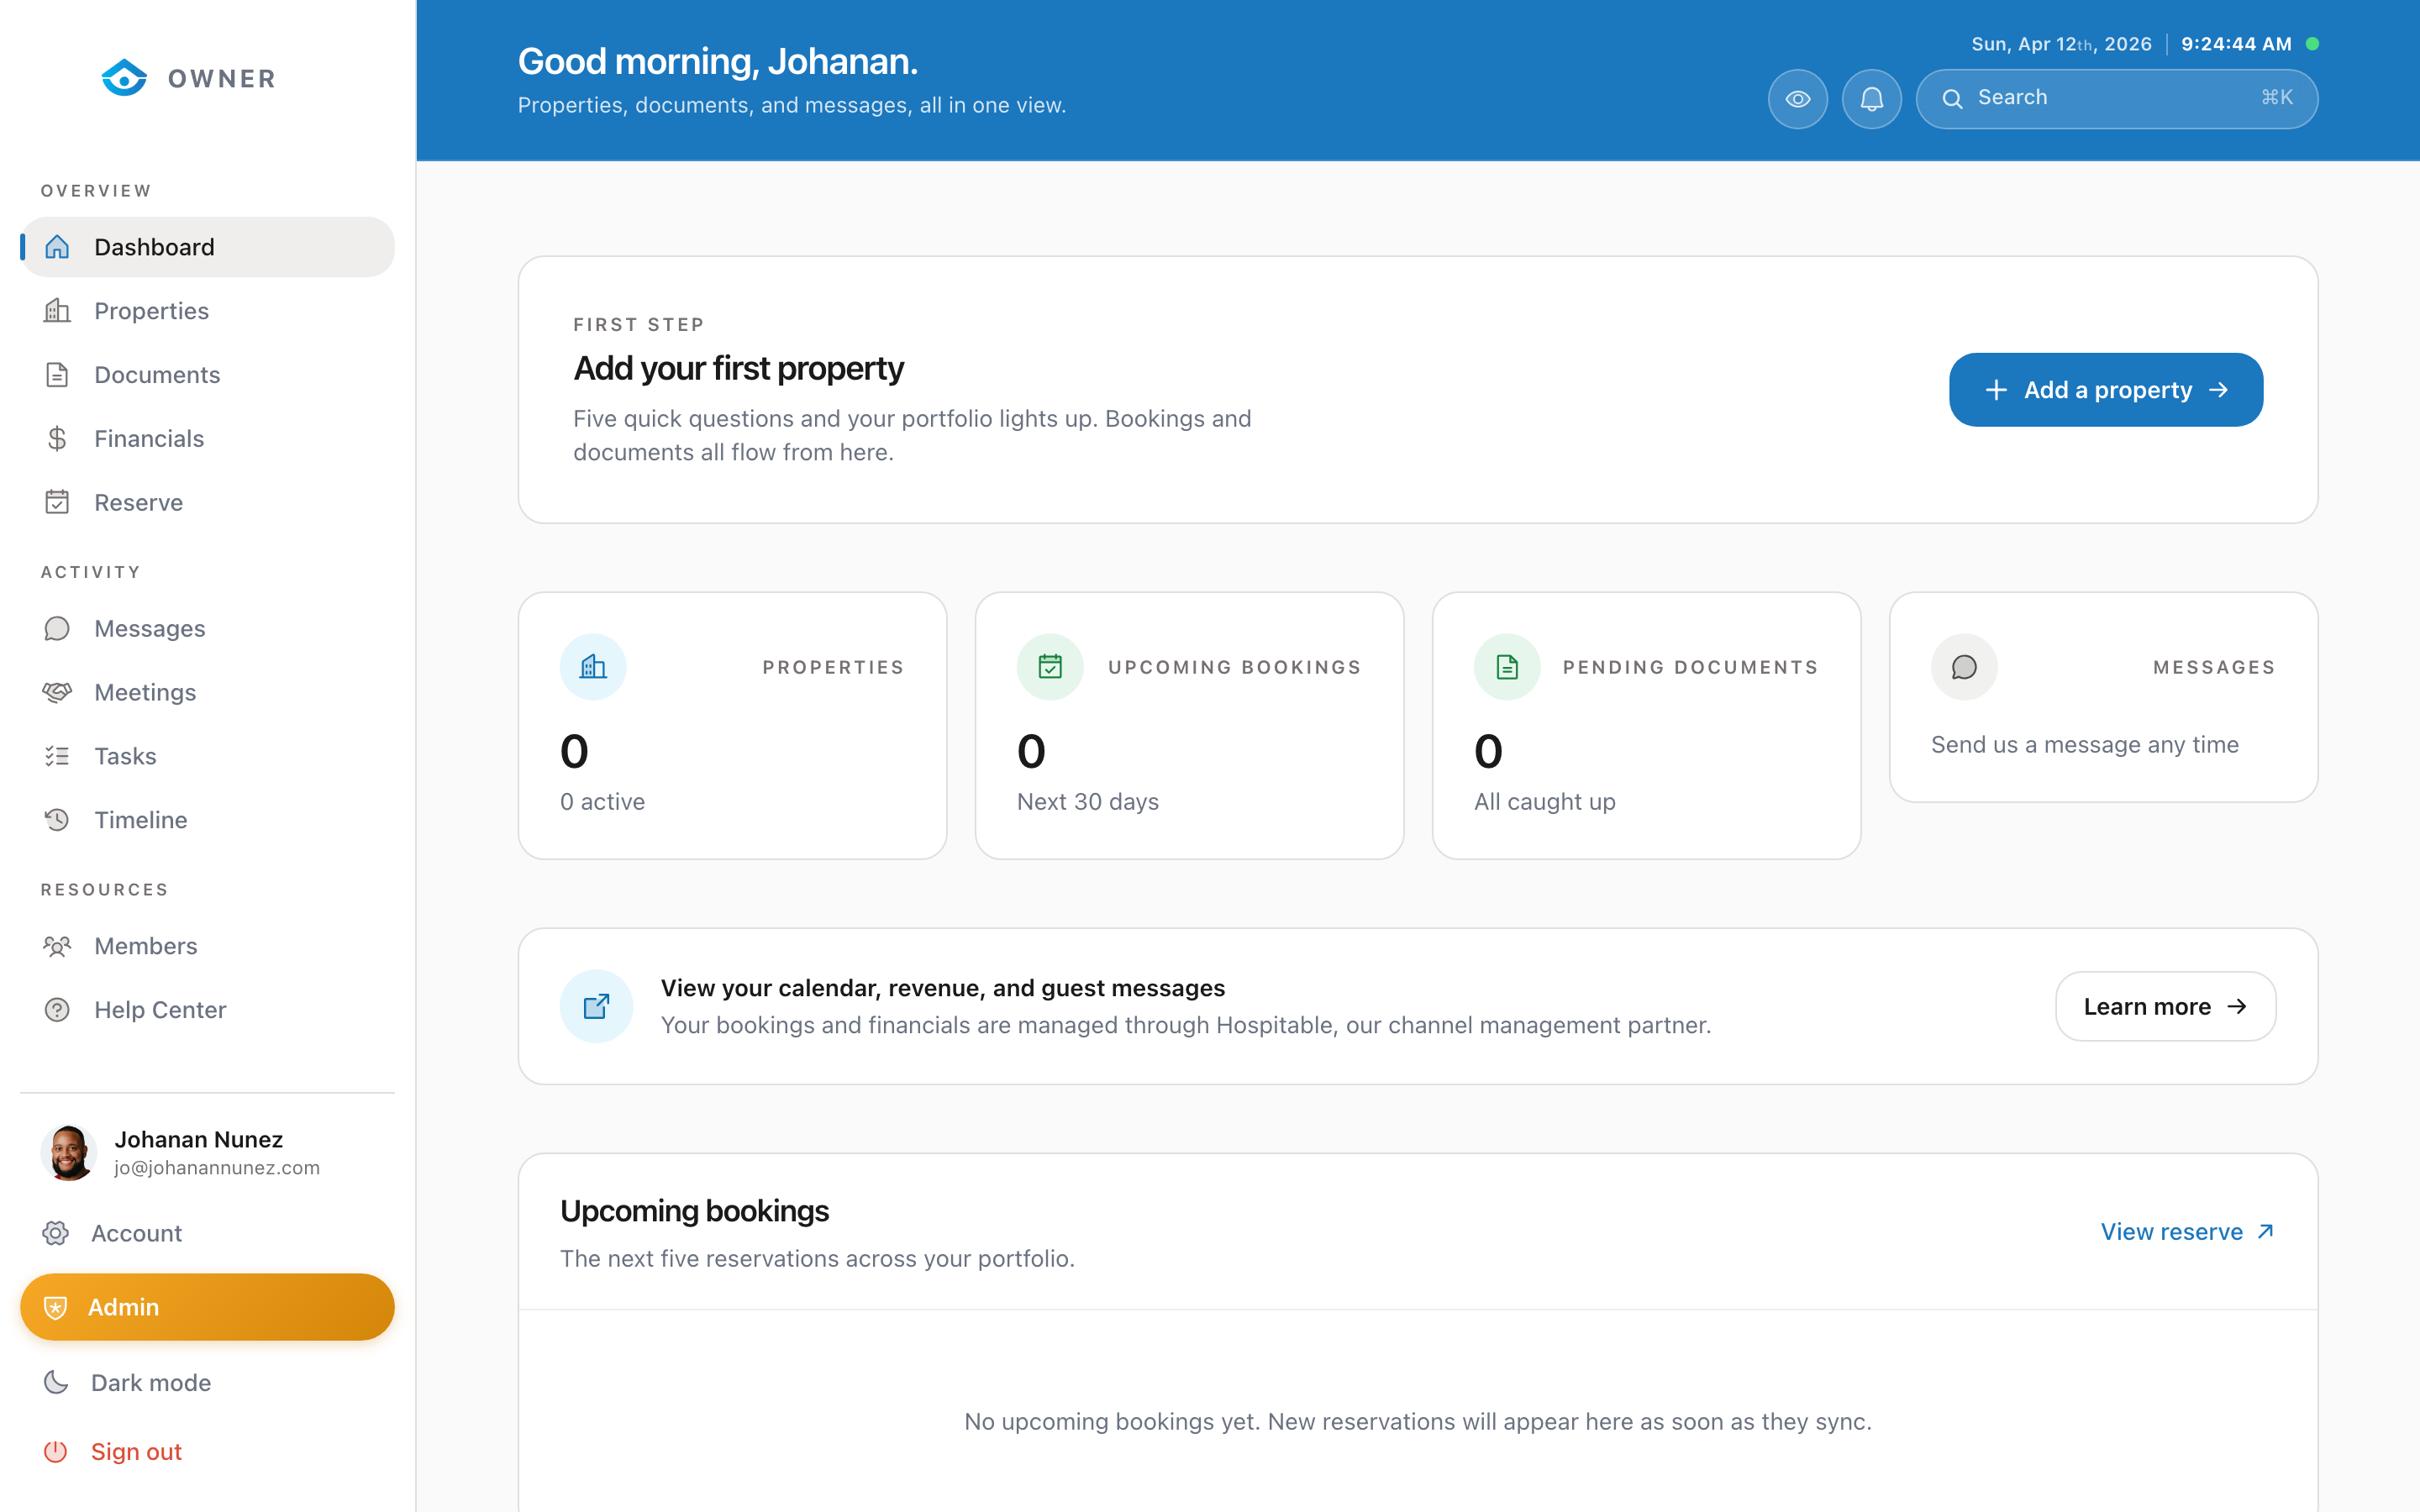
Your dashboard gives you a snapshot of how your property is performing.
Key metrics
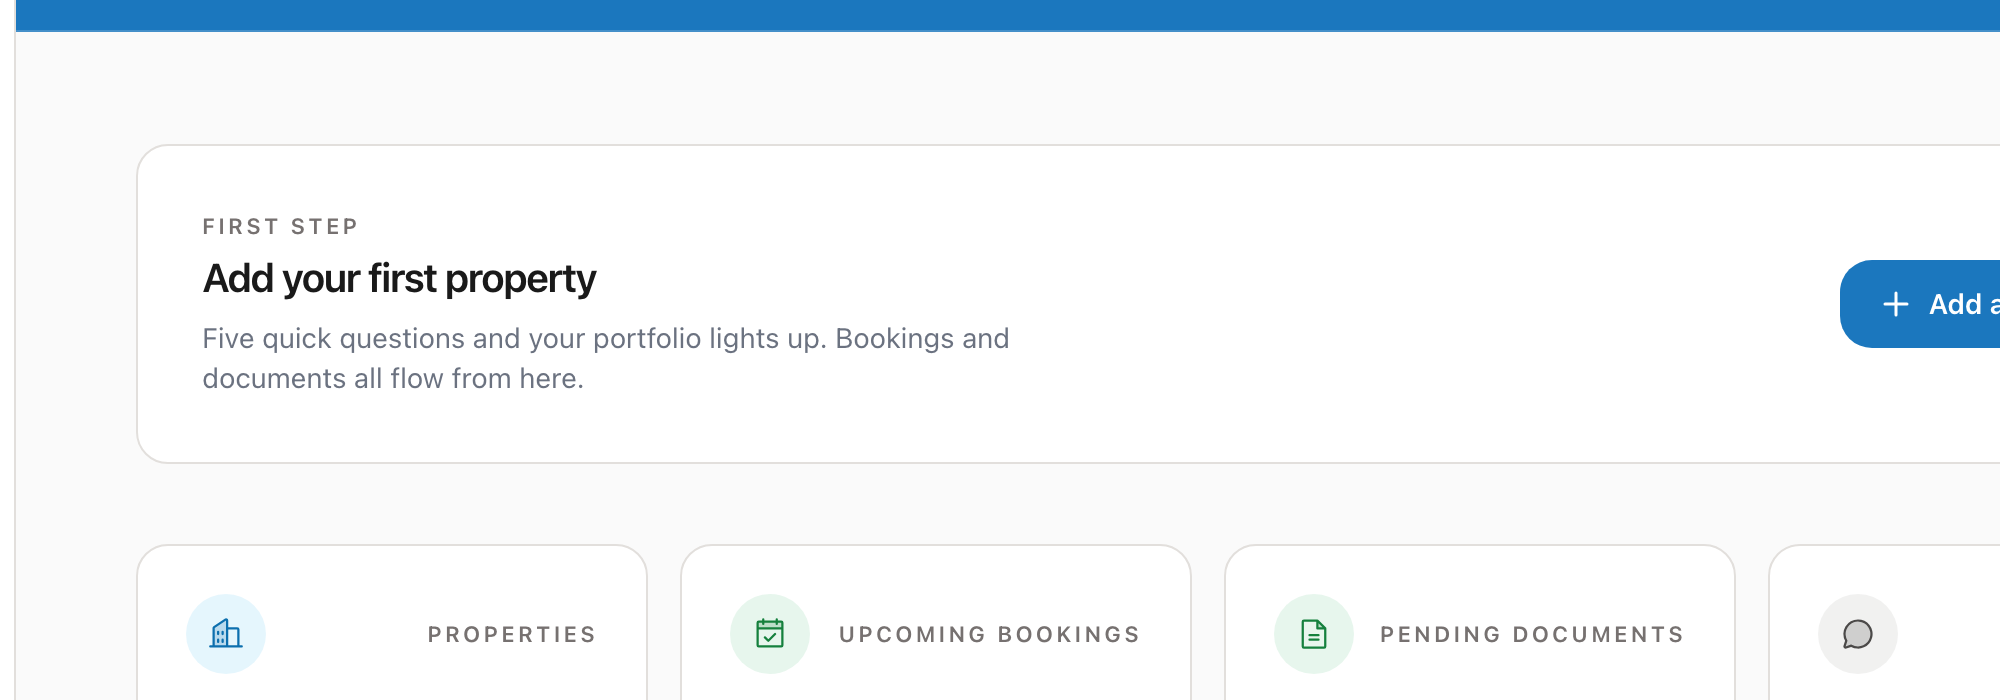
At the top of the dashboard, you will see cards showing:
- Revenue for the current period (month or custom range)
- Occupancy rate as a percentage
- Average nightly rate across your bookings
- Upcoming bookings count for the next 30 days
Period switcher
Use the period switcher at the top right to change the time range. You can view data for:
- This month
- Last month
- Last 3 months
- Last 6 months
- This year
- Custom date range
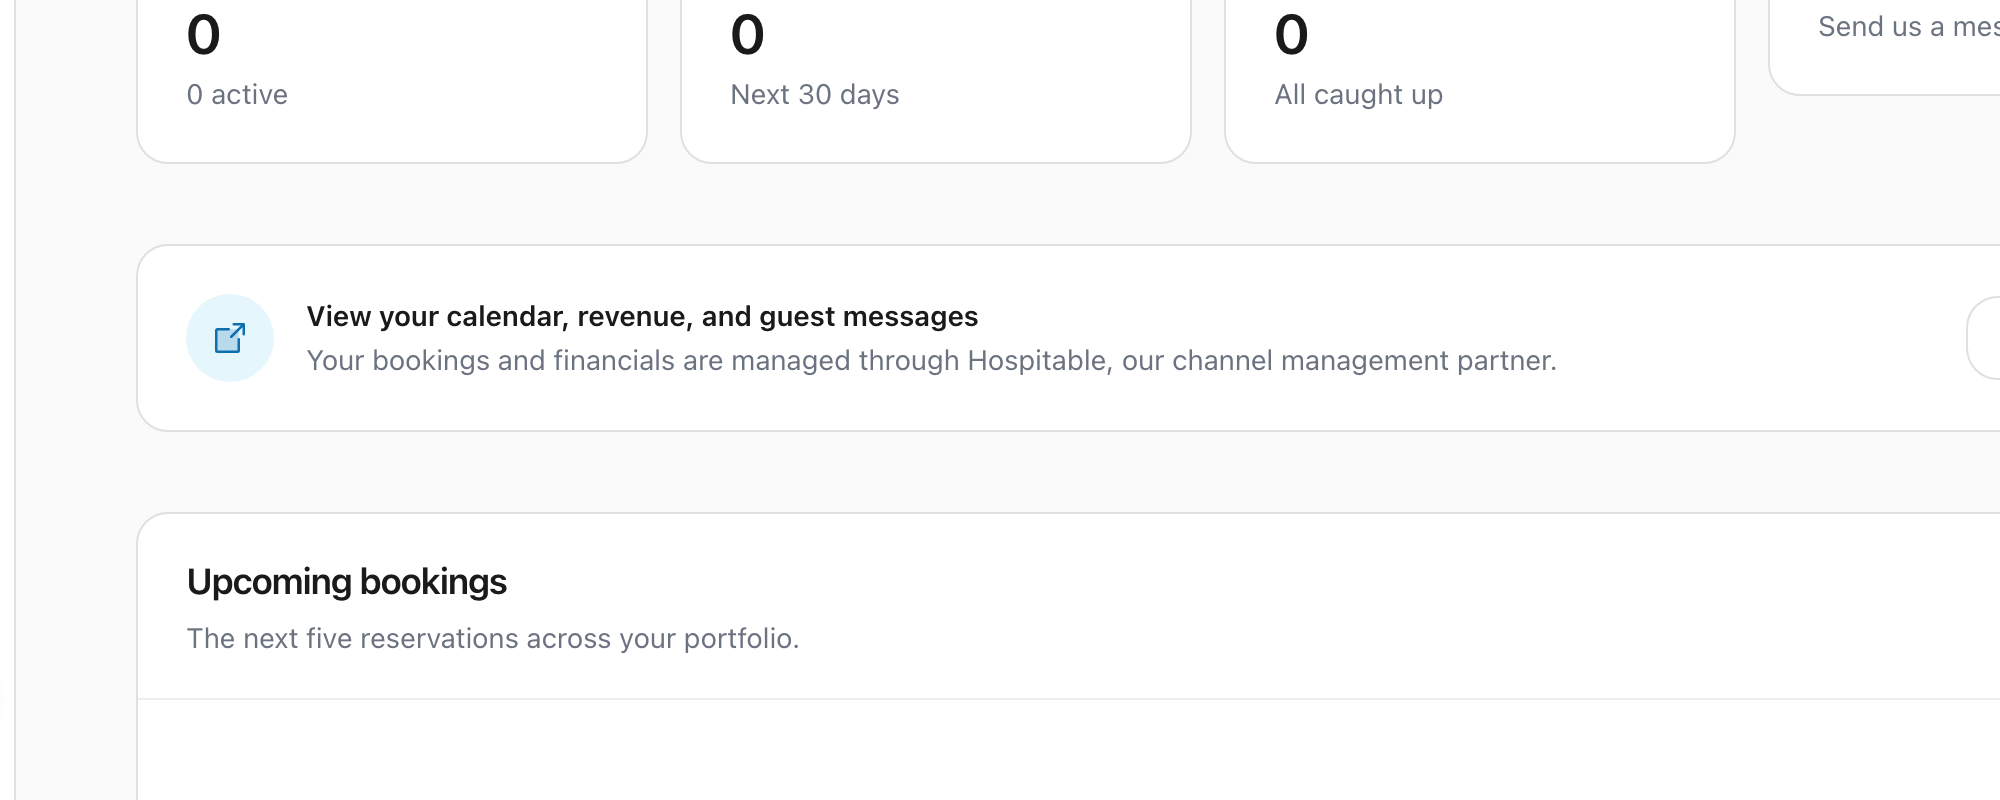
Upcoming bookings
Below the metrics, you will see a list of your next upcoming guest check-ins and check-outs. Each booking shows the guest name (first name only for privacy), dates, and booking source.
Revenue chart
The revenue chart shows your earnings over time as a line or bar chart. Hover over any point to see the exact amount for that period.
Recent activity
At the bottom, a timeline shows recent events: new bookings, payouts, messages, and status changes.
Was this helpful?